Key figures

CHF million

January – June 2021

January – June 2020

Change

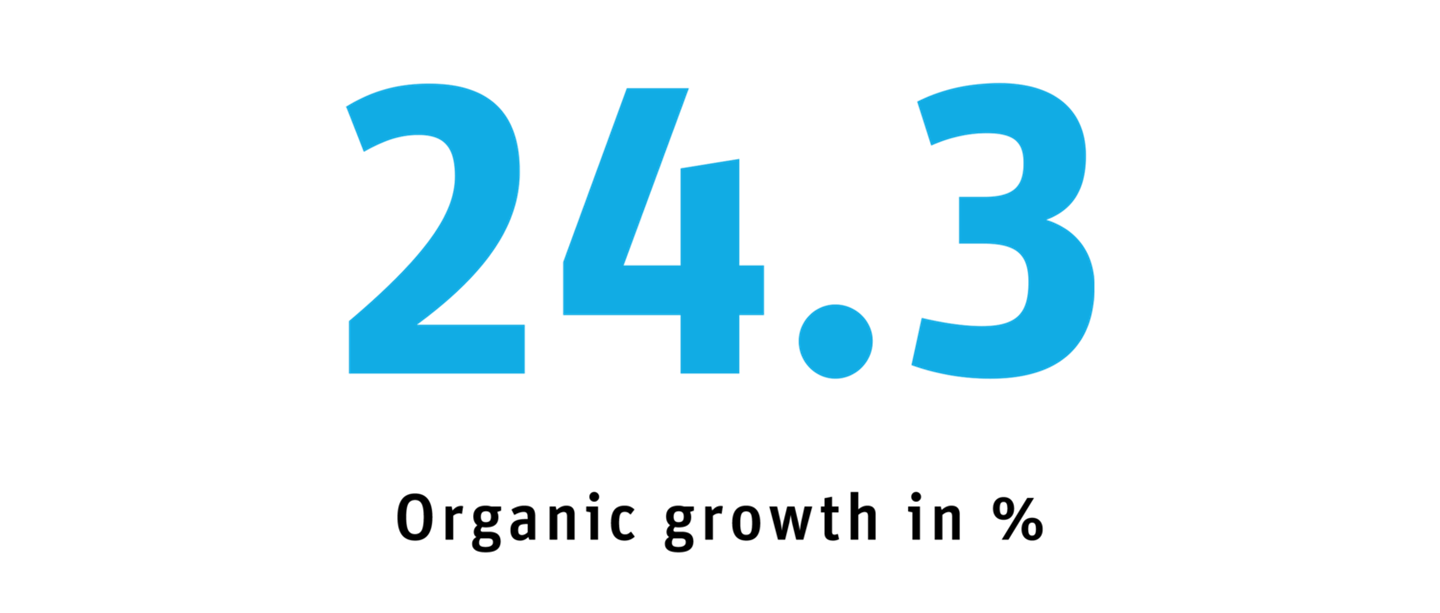
Organic growth1

Autoneum Group

Revenue

890.3

100.0%

730.6

100.0%

21.9%

24.3%

EBITDA

105.4

11.8%

31.2

4.3%

238.0%

EBIT

44.7

5.0%

–31.8

–4.4%

Net result

25.5

2.9%

–54.9

–7.5%

Return on net assets (RONA)2

6.0%

–6.4%

Free cash flow

67.2

–13.9

Net debt at June 303

229.8

372.8

Number of employees at June 304

12 093

12 479

–3.1%

BG Europe

Revenue

354.8

100.0%

273.2

100.0%

29.9%

27.4%

EBIT

26.6

7.5%

–4.8

–1.7%

BG North America

Revenue

356.0

100.0%

311.5

100.0%

14.3%

19.8%

EBIT

–10.0

–2.8%

–43.1

–13.8%

BG Asia

Revenue

134.1

100.0%

105.8

100.0%

26.8%

24.3%

EBIT

16.1

12.0%

4.8

4.5%

BG SAMEA5

Revenue

44.4

100.0%

37.9

100.0%

17.3%

44.3%

EBIT

6.4

14.5%

1.9

5.0%

Share AUTN

Share price at June 30 in CHF

172.70

92.50

86.7%

Market capitalization at June 30

802.4

428.8

87.1%

Basic earnings per share in CHF

4.35

–12.33

  1. 1 Change in revenue in local currencies, adjusted for hyperinflation.
  2. 2 Net result before interest expenses in relation to average shareholder's equity plus borrowings.
  3. 3 Net debt excluding lease liabilities at June 30.
  4. 4 Full-time equivalents including temporary employees (excluding apprentices).
  5. 5 Including South America, Middle East and Africa.